When your PC performance starts to lag, or you suspect a specific program is consuming too many resources, Windows offers a powerful built-in tool called Resource Monitor. Far more detailed than Task Manager for in-depth analysis, Resource Monitor provides real-time information about your CPU, disk, network, and memory usage. Learning how to monitor PC performance using Resource Monitor can help you diagnose bottlenecks, identify misbehaving applications, and optimize your system’s efficiency.
This guide will walk you through accessing and interpreting the various sections of Resource Monitor to get a clear picture of your computer’s health.
Why Use Resource Monitor to Monitor PC Performance?
- Detailed Resource Breakdown: See granular data on CPU, memory, disk I/O, and network activity for each process.
- Identify Bottlenecks: Spot which hardware component is limiting performance.
- Troubleshoot Applications: Find apps causing high resource usage.
- Monitor Network Use: See which applications are accessing the internet.
- Track Disk Activity: Discover which files and processes are using your hard drive.
How to Open Resource Monitor
Method 1: Via Task Manager
- Press Ctrl + Shift + Esc.
- Go to the Performance tab.
- Click Open Resource Monitor.
Method 2: Using Search
- Click Start or the Search icon.
- Type “Resource Monitor” or “resmon”.
- Click the result.
Method 3: Run Dialog
- Press Windows + R.
- Type resmon and press Enter.
Understanding the Resource Monitor Interface
Overview Tab
- Graphs: Show real-time usage for CPU, Disk, Network, and Memory.
- Processes List: Displays resource usage by process.
- Filtering: Click the checkbox next to a process to isolate its data.
Deep Dive: Resource Tabs
CPU Tab
- Processes: Shows CPU usage, process ID, description, and threads.
- Services: Related background services.
- Handles & Modules: Files or DLLs the process is using.
Troubleshooting Tip: High constant CPU usage might indicate a stuck or buggy app. Right-click to end or suspend it.
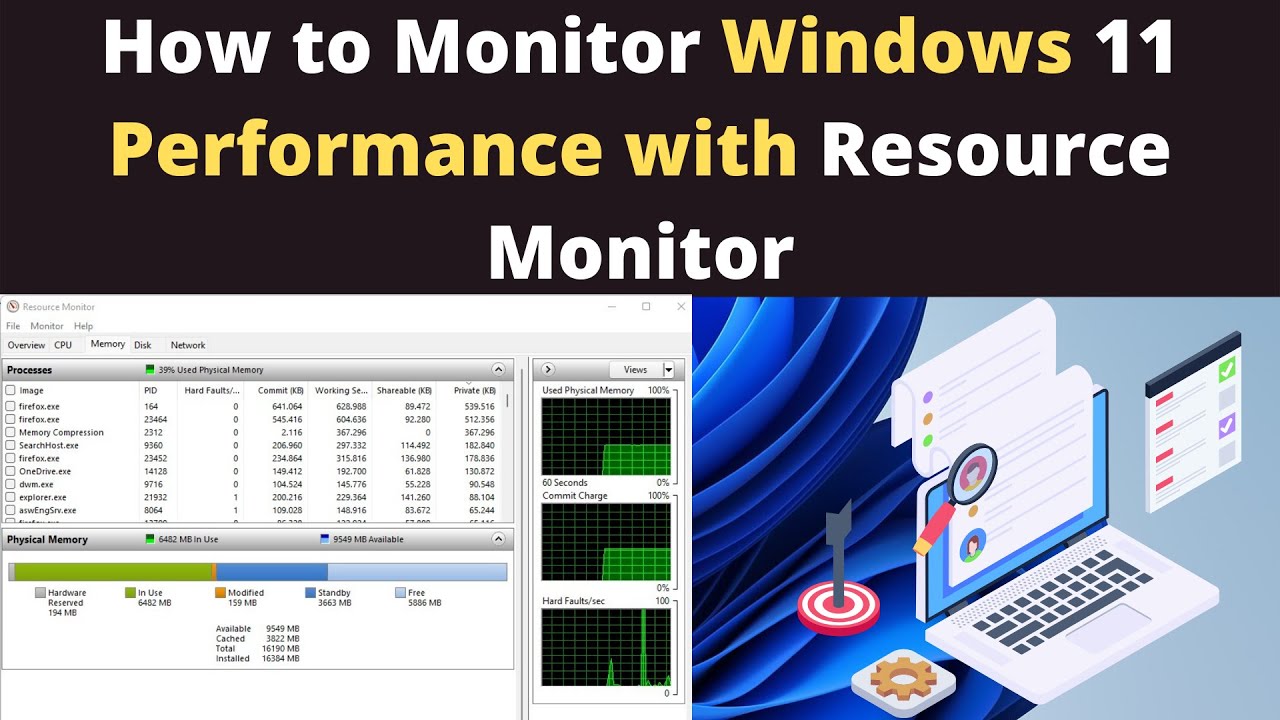
Memory Tab
- Processes: View hard faults, committed memory, working set, and private memory.
- Physical Memory Graph: Shows total, cached, and available memory.
Troubleshooting Tip: High hard faults often mean your PC is relying on disk due to low RAM.
Disk Tab
- Processes with Disk Activity: Identifies apps reading/writing to disk.
- Disk Activity: File-level access speeds.
- Storage: Logical disks, space, and usage.
Troubleshooting Tip: 100% disk activity suggests possible issues like antivirus scans or misbehaving apps.
Network Tab
- Processes with Network Activity: See what’s using your network.
- TCP Connections & Ports: Lists active and listening connections.
Troubleshooting Tip: Unexpected traffic or ports may signal malware.
Optimization Steps Using Resource Monitor
- Spot High Resource Apps: Track those consistently using CPU, RAM, etc.
- Investigate: Is the app legitimate? Outdated? Misbehaving?
- Disable/Uninstall: Remove problematic programs if needed.
- Scan for Malware: Run a virus scan if usage is suspicious.
- Consider Upgrades: If all resources are maxed out, hardware upgrades might be necessary.
Resource Monitor is an advanced yet user-friendly tool that gives deep insight into your PC’s performance. Check it regularly, especially during slowdowns, to keep your system running smoothly.